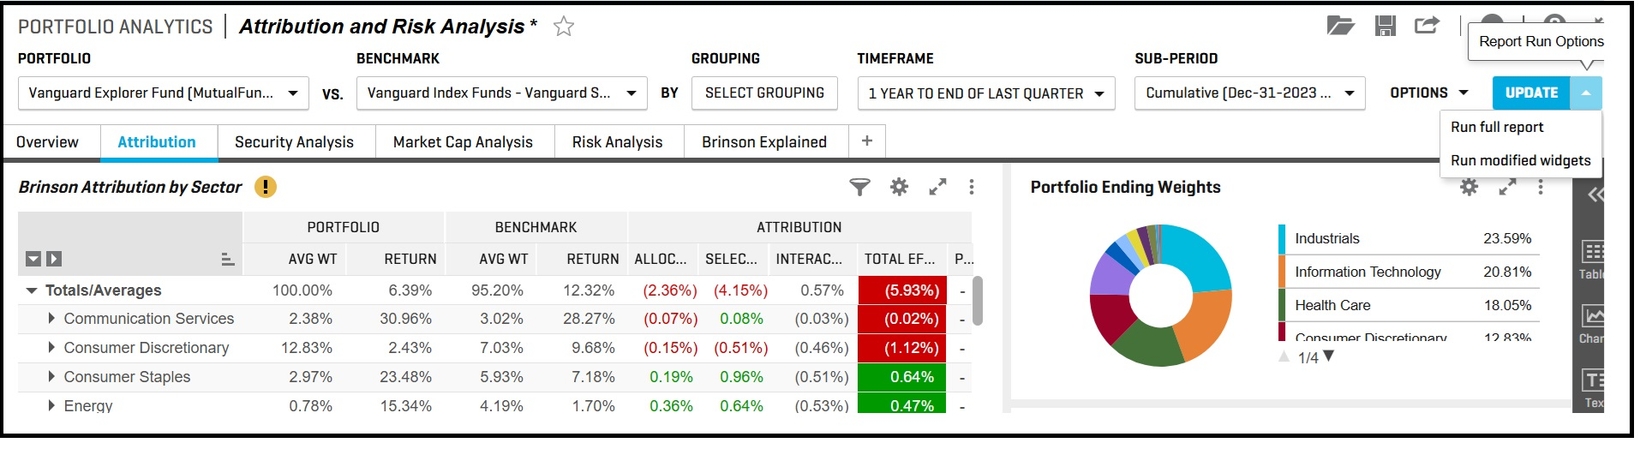
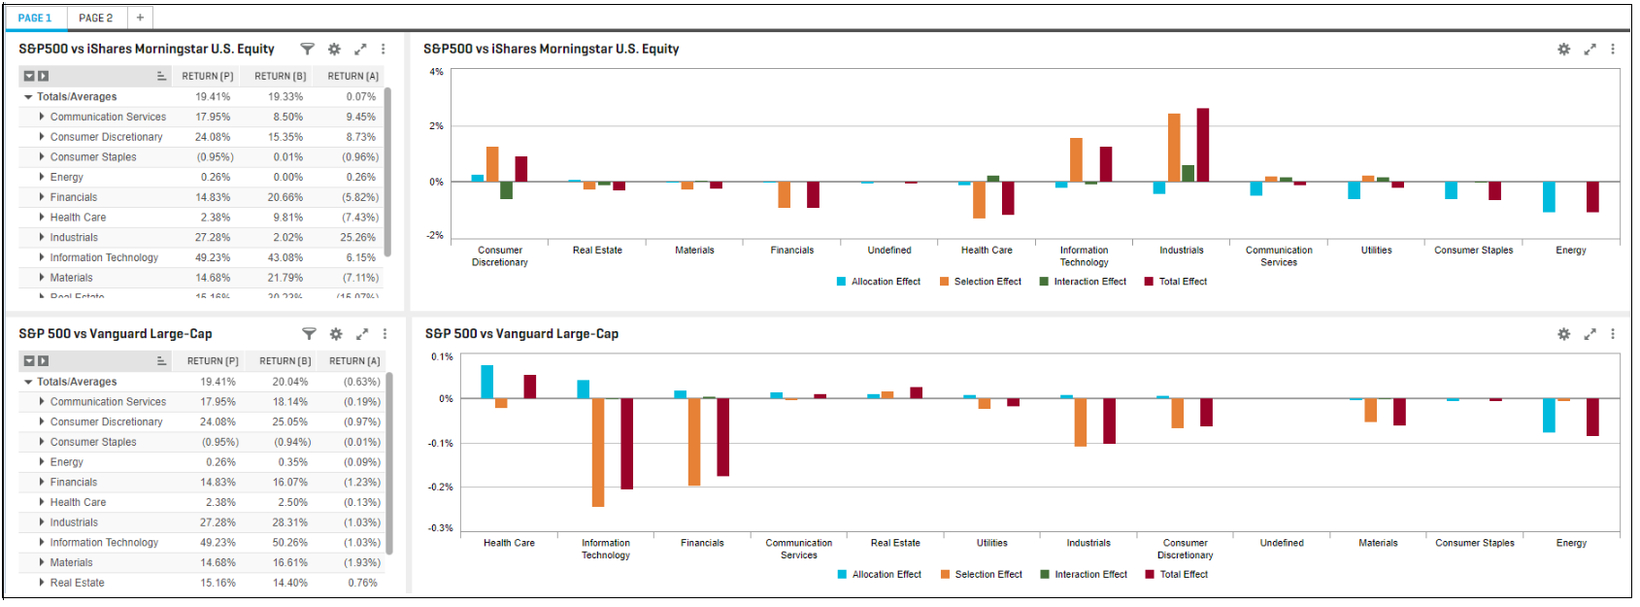
Portfolio Analytics RiskGauge Desktop Credit Analytics Capital IQ Plug-In June 2025 S&P Capital IQ Release Notes Explore the latest features from the June 2025 release, including Portfolio Analytics and the RiskGauge 3.0 model, which offers enhanced workflows and methodologies. June 27, 2025
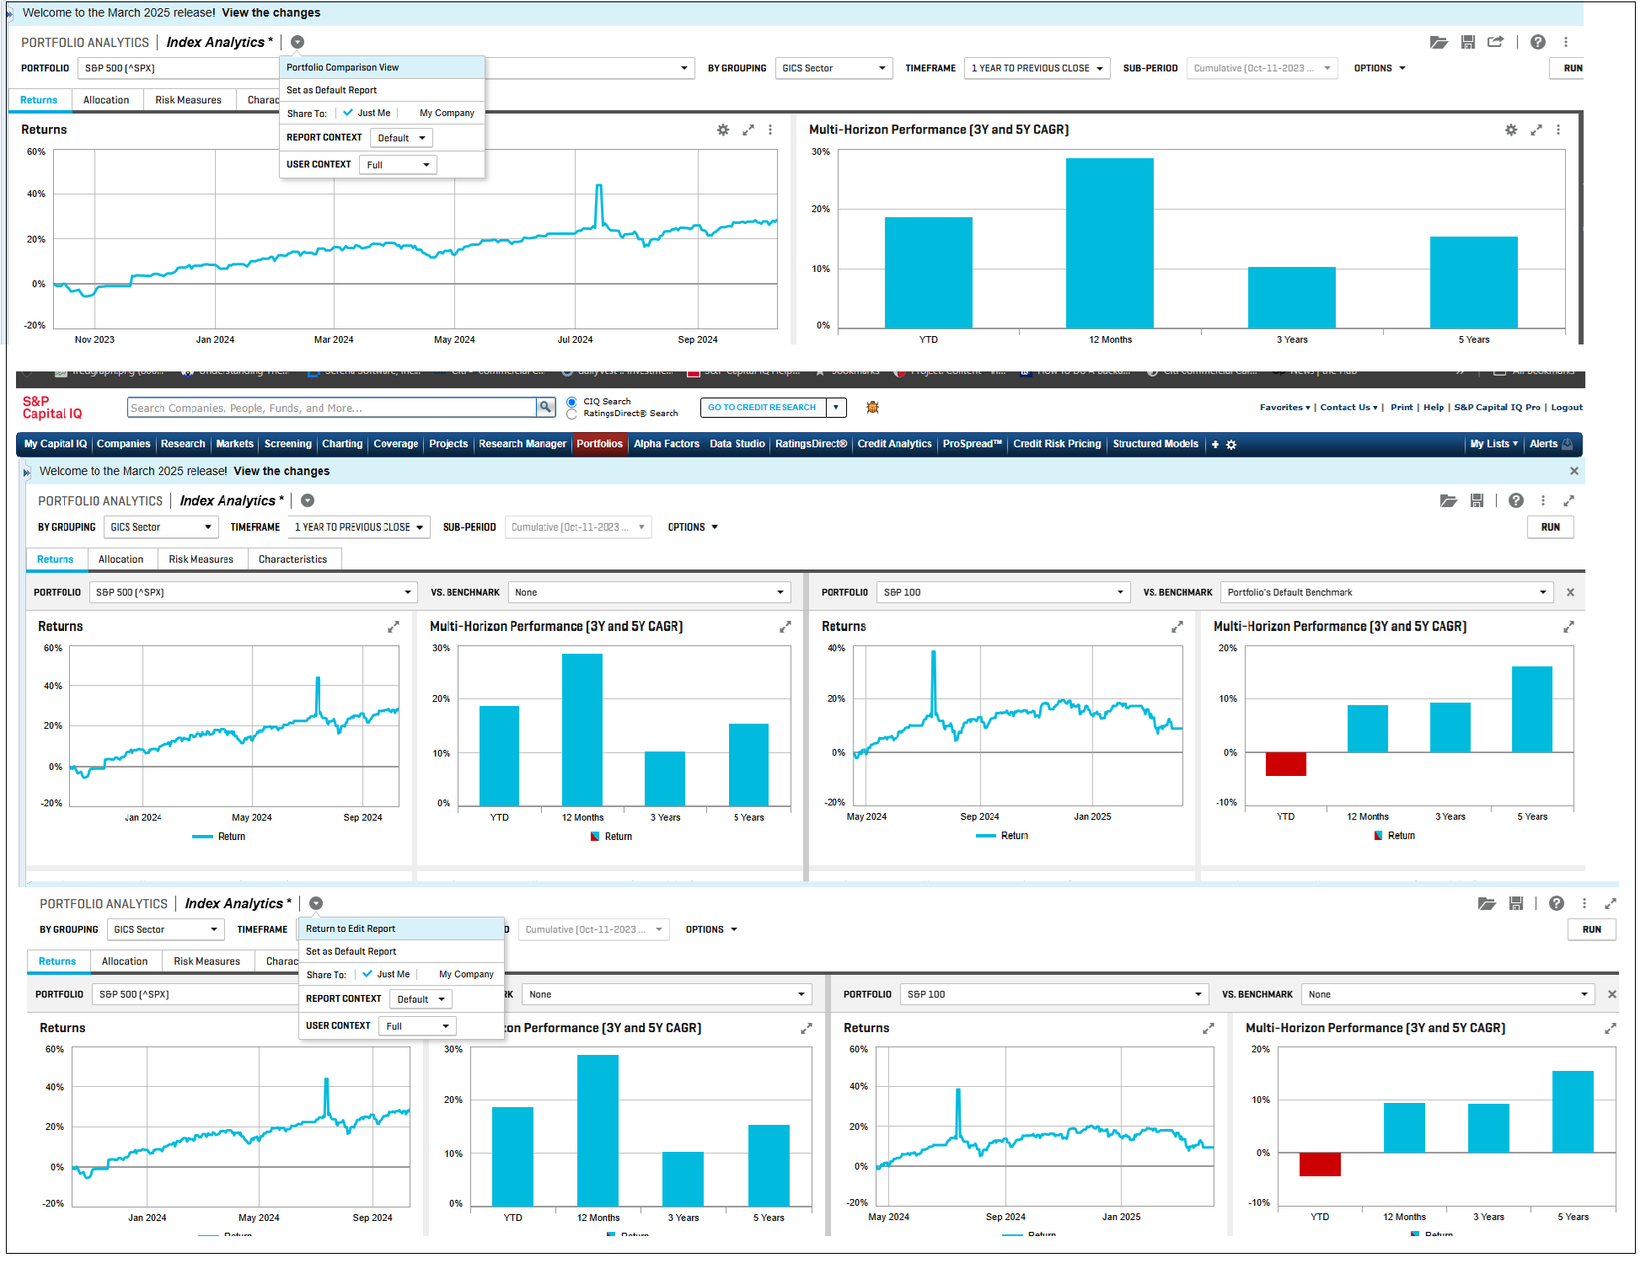
Portfolio Analytics Scorecards ProSpread Credit Analytics Capital IQ Plug-In March 2025 S&P Capital IQ Release Notes Explore the latest features from the March 2025 release, including Portfolio Analytics, Cash Flow data input template in the Project Finance app, ‘Save Progress’ feature in ProSpread and GSAC V3 Bond Sector Curves in the S&P Capital IQ Plug-In. March 15, 2025
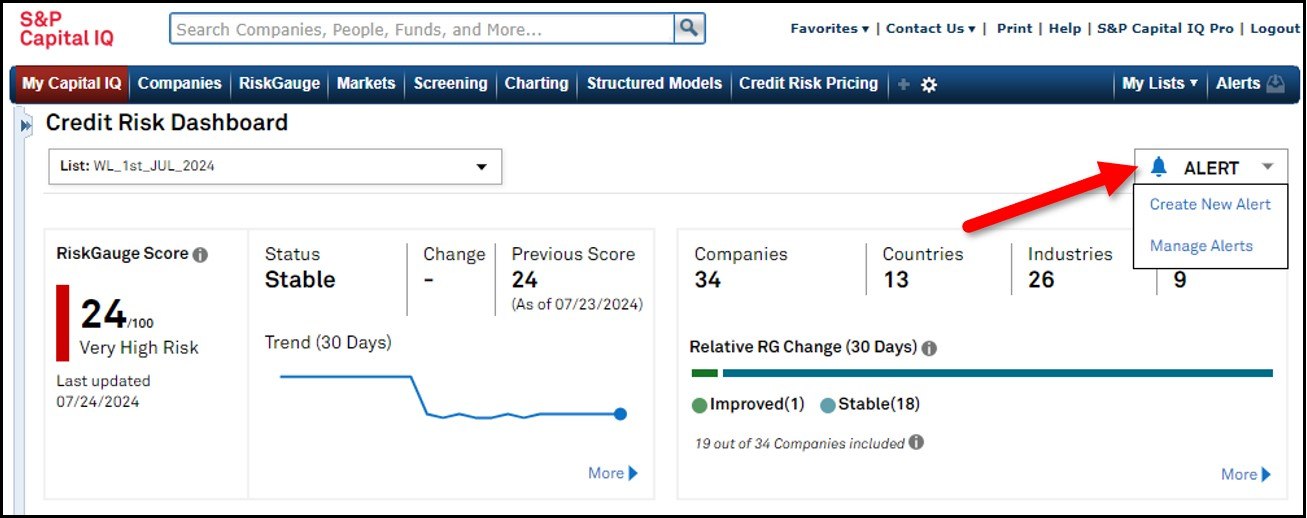
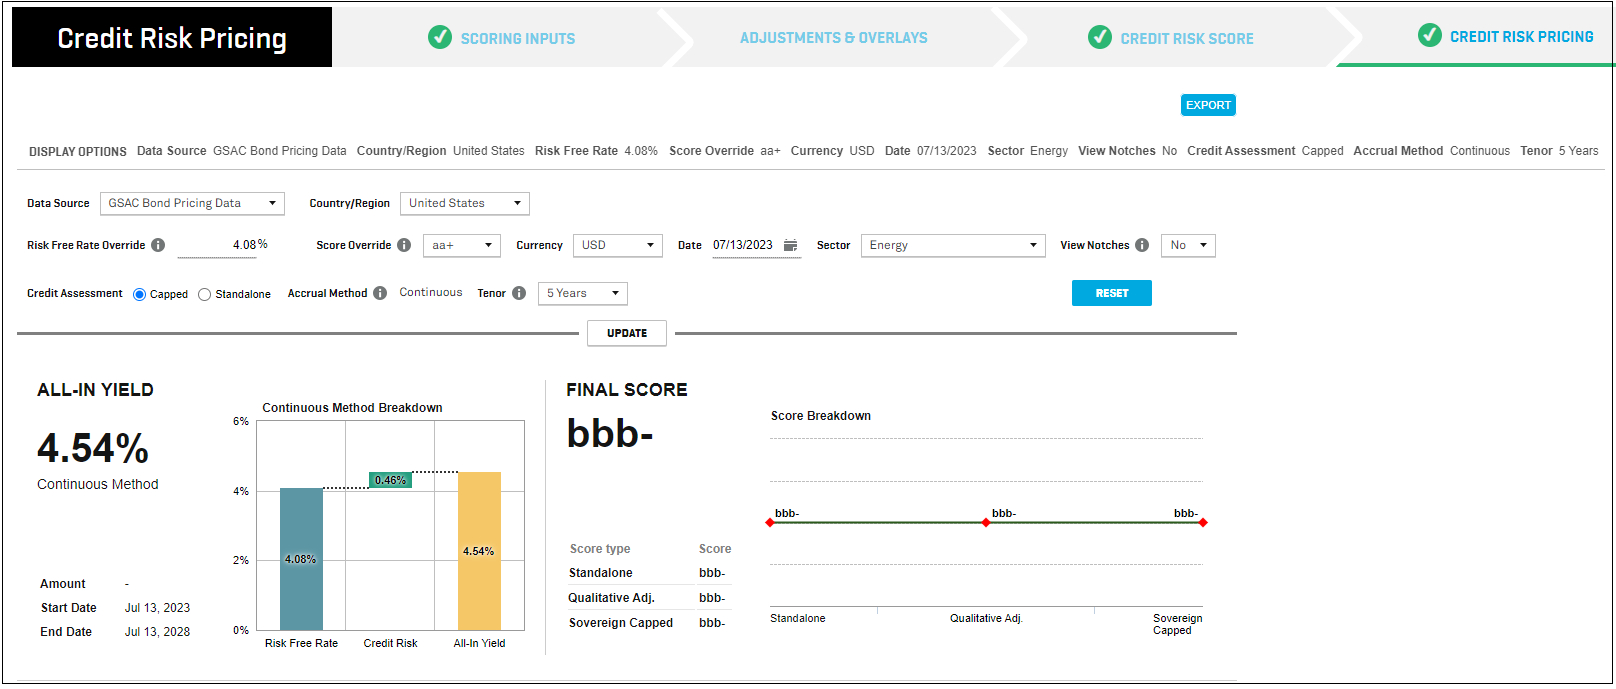
Portfolio Analytics RiskGauge Desktop Credit Risk Pricing Scorecards ProSpread Credit Analytics Capital IQ Plug-In December 2024 S&P Capital IQ Release Notes Explore the latest features from the December 2024 release, including Portfolio Analytics, targeted alerts in RiskGauge Desktop, GSAC Bond Sector Curves in Credit Risk Pricing, General Corporate Scorecard beta and ProSpread Excel-like interface. December 15, 2024
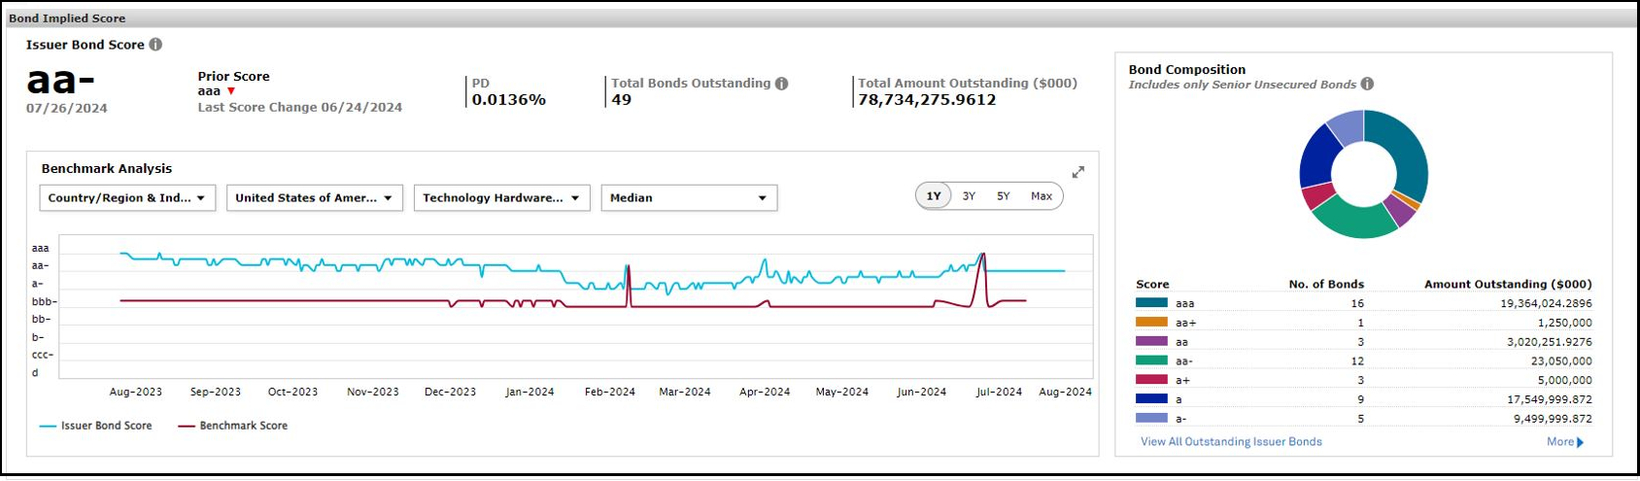
Portfolio Analytics Credit Analytics RiskGauge Desktop Scorecards ProSpread September 2024 S&P Capital IQ Release Notes Explore the latest features from the September 2024 release, including Portfolio Analytics Batch Scheduler, Bond Implied Scoring model in Credit Analytics and key updates to the Project Finance Scorecard. September 15, 2024
Portfolio Analytics Credit Analytics Fixed Income S&P Capital IQ Plug-in June 2024 S&P Capital IQ Release Notes Explore the latest features from the June 2024 release, including 19.4 million Government, Supranational, Agency and Corporates (GSAC) securities from Markit, Portfolio Analytics and Credit Analytics. June 15, 2024
Portfolio Analytics Credit Analytics March 2024 S&P Capital IQ Release Notes Explore the latest features from the March 2024 release, including Portfolio Analytics support for private company asset class, GSAC Bond Pricing in Credit Risk Pricing and enhanced Macro Scenario Analysis. March 15, 2024